class: title-slide, center, middle # Computational Archaeology ## 01 - Introduction ### Martin Hinz #### Institut für Archäologische Wissenschaften, Universität Bern 18/09/19 --- ## What is not computational archaeology ### in relation to our course .center[] --- ## What is computational archaeology ### Topics<sup>*</sup> .pull-left[ 1. The use of **digital data** in archaeological research. 2. The general **use of computers** in archaeological research. 3. The use of **computational algorithms to fill gaps in archaeological data** in ways that can’t be done with traditional techniques. 4. **Data mining** and **multidimensional analyses** of archaeological data. 5. The use of **simulation models and artificial intelligence** to understand the processes and dynamics of past societies. 6. The use of **computer visualizations** to create immersive **virtual** experiences of archaeological sites and materials .footnote[[*] from http://isaacullah.github.io/What-is-Computational-Archaeology/] ] .pull-right[  ] --- ## What is computational archaeology ### Fields<sup>*</sup> .pull-left[ 1. **GIS and geospatial data analysis.** 2. **Digital imagery and photogrammetry.** 3. **Statistical computing and quantitative analysis.** 4. **Data visualization.** 5. Agent Based Modeling and simulation. 6. 3D modeling, virtual reality, and augmented reality. 7. Video gaming and digital animation. We will touch the **highlighted** subjects. .footnote[[*] from http://isaacullah.github.io/What-is-Computational-Archaeology/] ] .pull-right[ 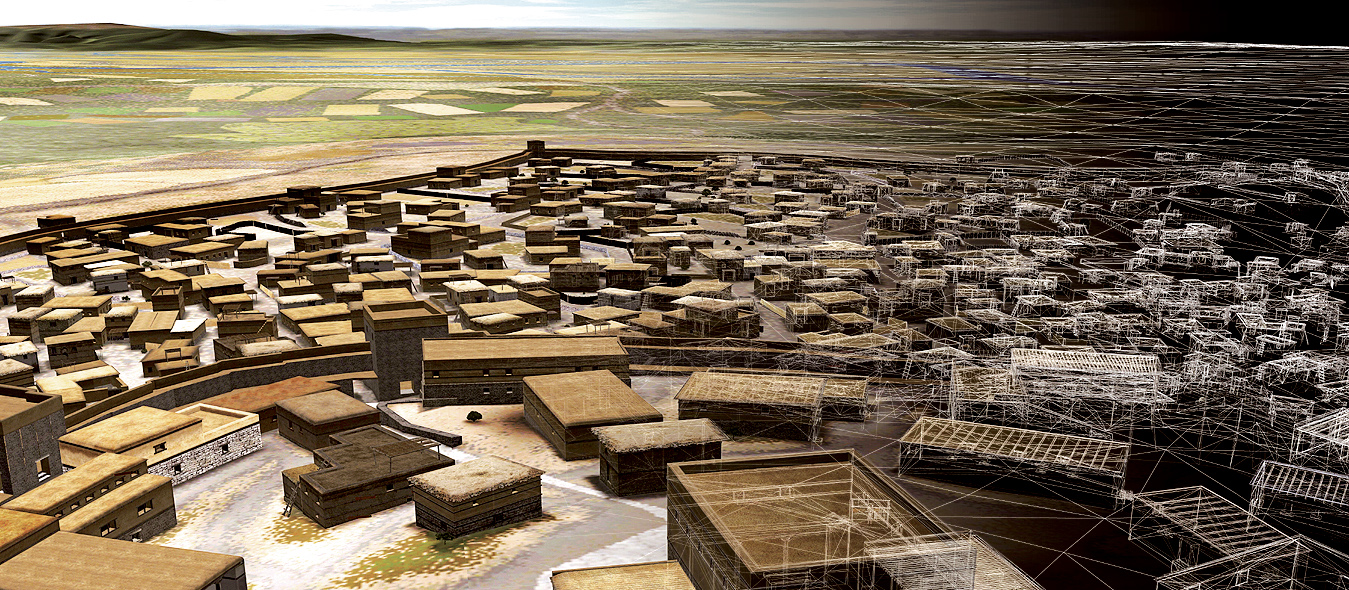 .caption[Sorry, no fancy 3D Modelling (this time)] ] --- ## Other terms .pull-left[ * Cyber Archaeology * Digital Archaeology * Archaeoinformatics * Digital Humanities  ] .pull-right[ 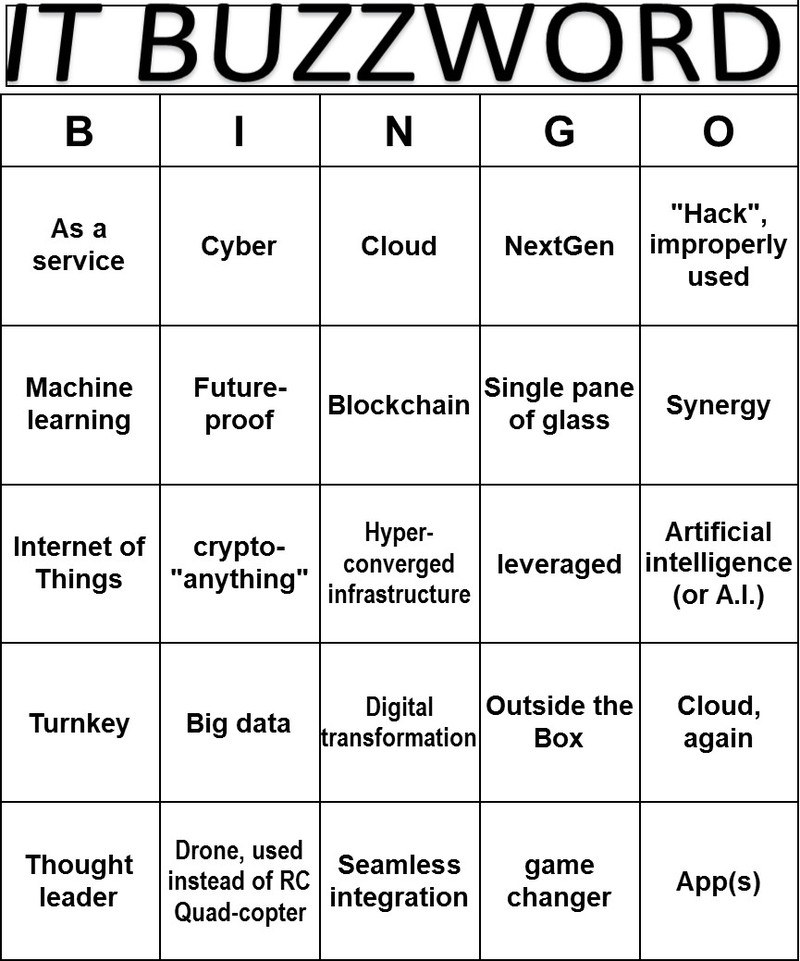 ] --- ## Schedule <table class="table table-striped table-hover" style="margin-left: auto; margin-right: auto;"> <thead> <tr> <th style="text-align:left;"> date </th> <th style="text-align:left;"> topic </th> <th style="text-align:left;"> Software </th> </tr> </thead> <tbody> <tr> <td style="text-align:left;"> 18/09/19 </td> <td style="text-align:left;"> Introduction </td> <td style="text-align:left;"> Your Brain </td> </tr> <tr> <td style="text-align:left;"> 25/09/19 </td> <td style="text-align:left;"> Your Computer as research tool </td> <td style="text-align:left;"> Libre Office Writer, Zotero </td> </tr> <tr> <td style="text-align:left;"> 02/10/19 </td> <td style="text-align:left;"> Data Bases I </td> <td style="text-align:left;"> Libre Office Base </td> </tr> <tr> <td style="text-align:left;"> 09/10/19 </td> <td style="text-align:left;"> Data Bases II </td> <td style="text-align:left;"> Libre Office Base </td> </tr> <tr> <td style="text-align:left;"> 23/10/19 </td> <td style="text-align:left;"> Visualisation I </td> <td style="text-align:left;"> Libre Office Calc </td> </tr> <tr> <td style="text-align:left;"> 30/10/19 </td> <td style="text-align:left;"> Visualisation II </td> <td style="text-align:left;"> Libre Office Calc, TOSCA </td> </tr> <tr> <td style="text-align:left;"> 06/11/19 </td> <td style="text-align:left;"> Basic Statistics / Hypothese testing </td> <td style="text-align:left;"> Libre Office Calc </td> </tr> <tr> <td style="text-align:left;"> 13/11/19 </td> <td style="text-align:left;"> 14C Calibration I </td> <td style="text-align:left;"> OxCal </td> </tr> <tr> <td style="text-align:left;"> 20/11/19 </td> <td style="text-align:left;"> 14C Calibration II </td> <td style="text-align:left;"> OxCal </td> </tr> <tr> <td style="text-align:left;"> 27/11/19 </td> <td style="text-align:left;"> GIS I </td> <td style="text-align:left;"> QGIS </td> </tr> <tr> <td style="text-align:left;"> 04/12/19 </td> <td style="text-align:left;"> GIS II </td> <td style="text-align:left;"> QGIS </td> </tr> <tr> <td style="text-align:left;"> 11/12/19 </td> <td style="text-align:left;"> Digital Documentation </td> <td style="text-align:left;"> Your Brain </td> </tr> </tbody> </table> --- ## Computers as research tools ### What is it - review literature - collect data - structure information - process images - write a paper .center[  vs.  ] --- ## Computers as research tools ### only session .pull-left[ - Types of Digital Data - Working with Digital Data - Software suggestions - Using citation software  ] .pull-right[ - structuring your research environment - working with open and sustainable formats - glimpse on - markdown - latex - version control  ] --- ## Databases ### What is it .pull-left[ > A database is an organized collection of data, generally stored and accessed electronically from a computer system. - Wikipedia - on one computer -> for personal data organisation - Libre Office, MS Access, Sqlite - single file - server - client, often web based - PostgreSQL, MySQL - data exchange and collaborative data management ] .pull-right[ Relates different information on different abstraction levels eg.: 1 site <-> multiple artefacts <div id="htmlwidget-1fc967c6d77360b5cdd5" style="width:400px;height:100px;" class="grViz html-widget"></div> <script type="application/json" data-for="htmlwidget-1fc967c6d77360b5cdd5">{"x":{"diagram":"\ndigraph models_diagram {\n rankdir=\"LR\";\n graph[overlap=false, splines=true]\n \"site\" [shape=record, label=\"{\\\n site|name :string\\l\\\n lat :float\\l\\\n lng :float\\l\\\n }\"]\n \n \"artefact\" [shape=record, label=\"{artefact|\\\n material :string\\l\\\n weight :string\\l\\\n }\"]\n \n\n \"site\" -> \"artefact\" [arrowtail=odot, arrowhead=crow, dir=both, label=\"belongs_to\"]\n}","config":{"engine":"dot","options":null}},"evals":[],"jsHooks":[]}</script> ] --- ## Databases ### First section .pull-left[ Create a simple data base - site information - artefact information - lookup tables  ] .pull-right[ Topics - data normalisation - table design - variable types - form creation  ] --- ## Databases ### Second section .pull-left[ Retrieve informations from the data base - queries - joining tables - exporting data .center[] ] .pull-right[ Topics - query logic - sql - csv  ] --- ## Visualisation ### What is it > Data visualization is the graphic representation of data. It involves producing images that communicate relationships among the represented data to viewers of the images. - wikipedia - 'statistical' charts like barcharts, pie charts, scatterplots... - humans are visual animals - explore data / find structures - visualise multidimensional relationships .center[ 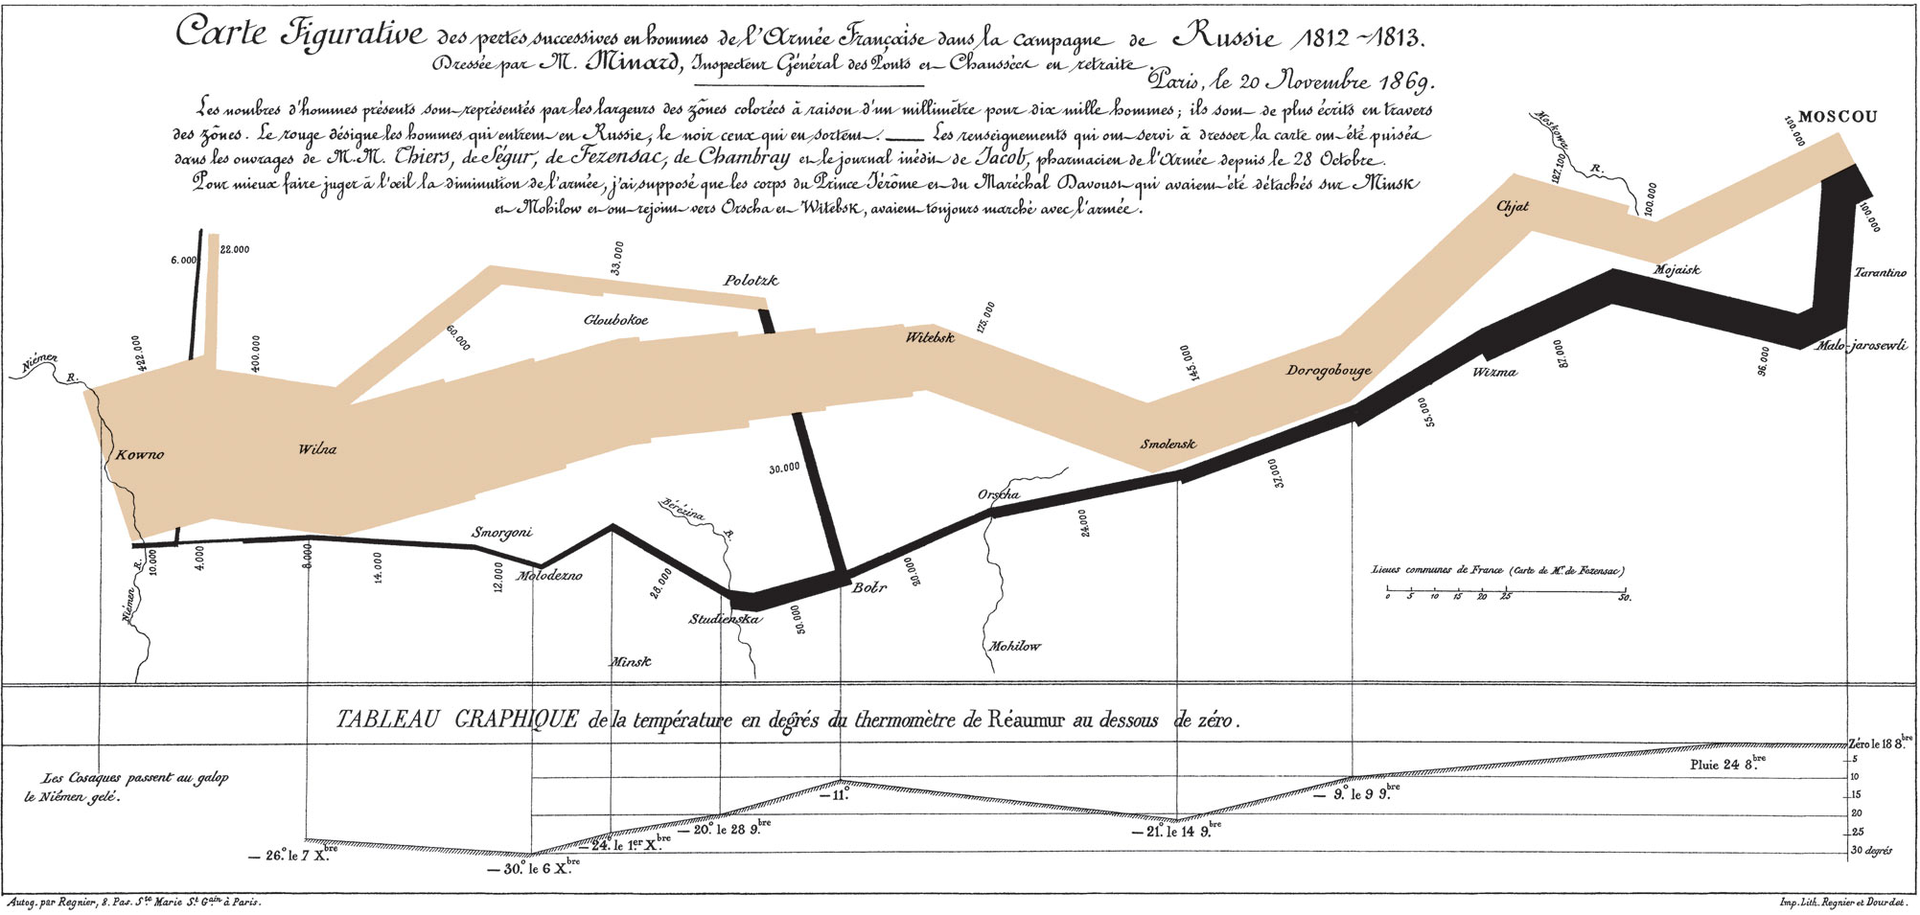 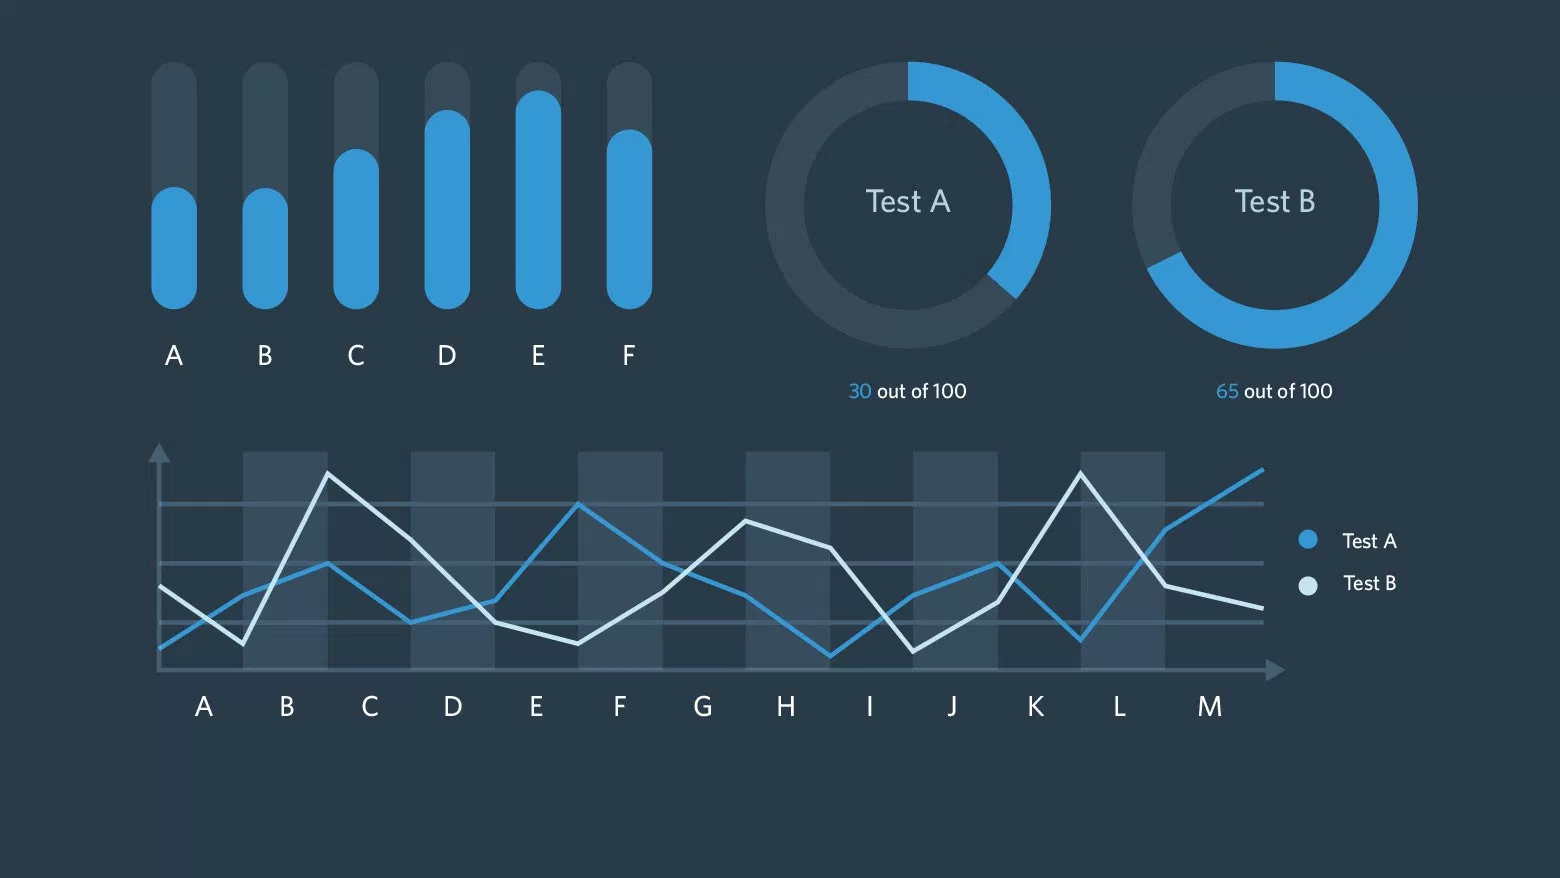] --- ## Visualisation ### First section .pull-left[ - prepare your data for visualisation - Basic visualisation using spreadsheat software (LibreOffice Calc) - export for later (re)use 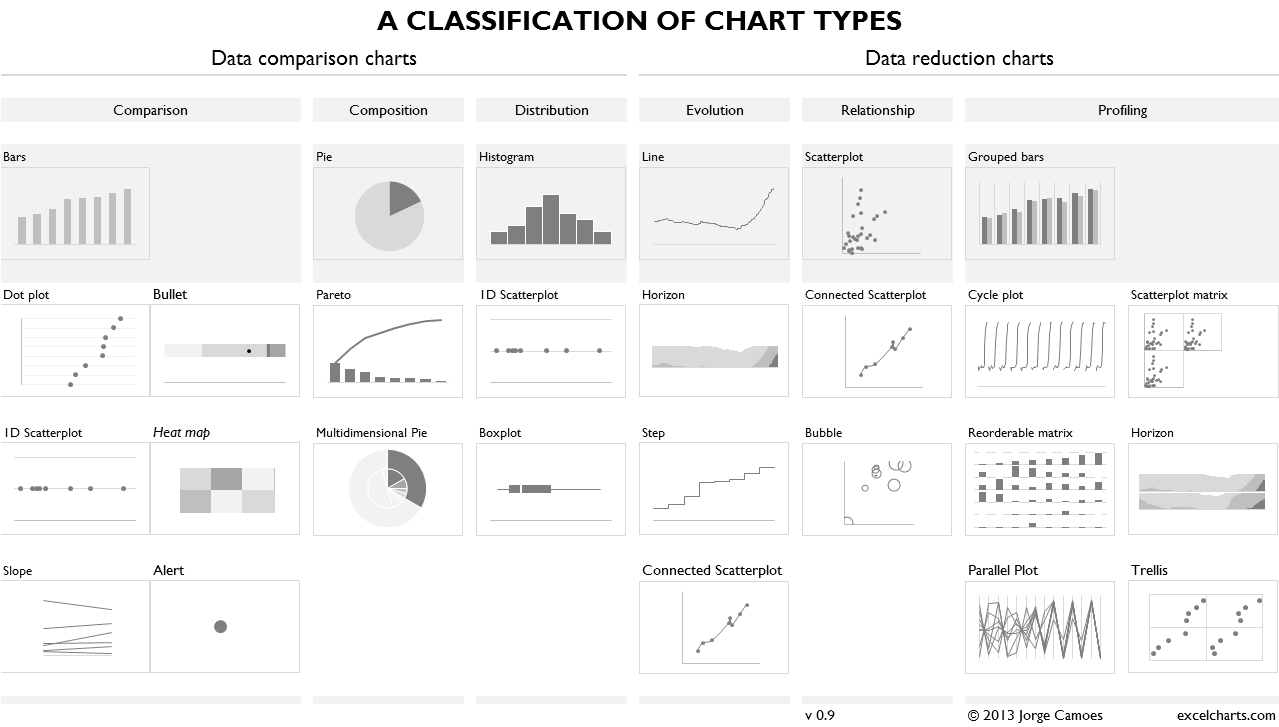 ] .pull-right[ - handling spreadsheat software - scatterplots, bar charts, histograms - visualisation best practises 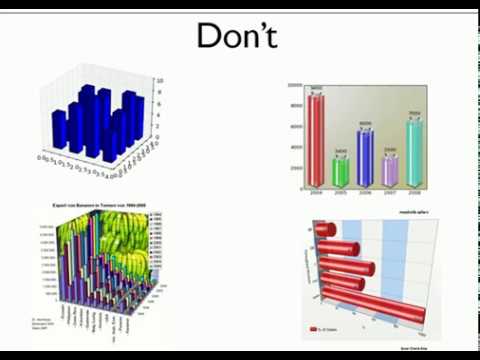 ] --- ## Visualisation ### Second section .pull-left[ - Visualisation of highdimensional data - Correspondence Analysis - Seriation 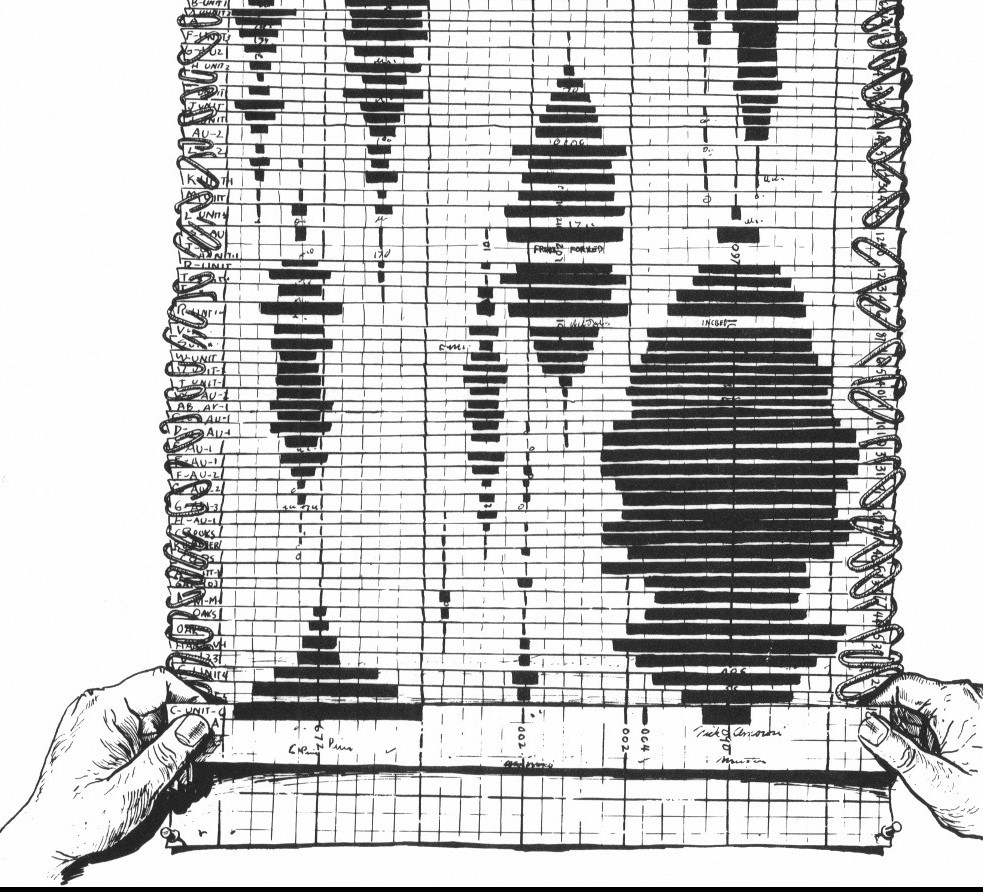 ] .pull-right[ - preparing your data - conduct correspondence analysis - interpret the result 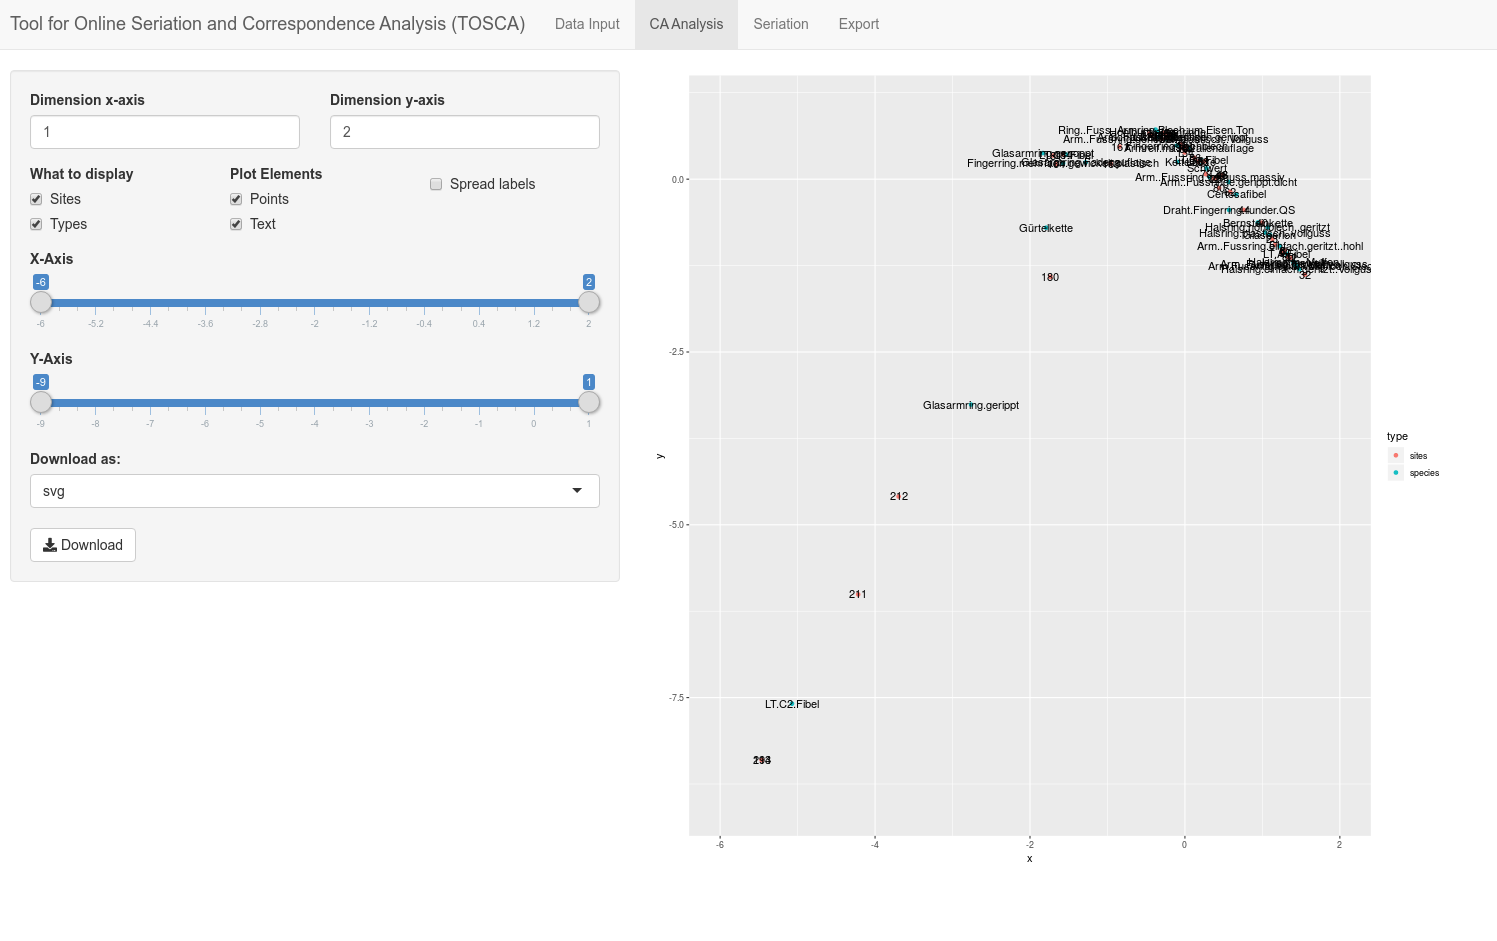 ] --- ## Basic Statistics / Hypothese testing ### What is it > A statistical hypothesis, sometimes called confirmatory data analysis, is a hypothesis that is testable on the basis of observing a process that is modeled via a set of random variables.[1] A statistical hypothesis test is a method of statistical inference. - wikipedia - decide between hypotheses using standardised (mathematical) tools - probability theory - scientific method .center[ 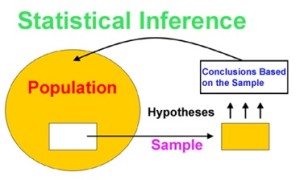 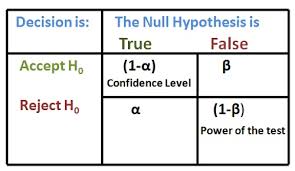 ] --- ## Basic Statistics ### Only section .pull-left[ - Basics of hypothese testing - H_0_ and H_1_ - statistical significance 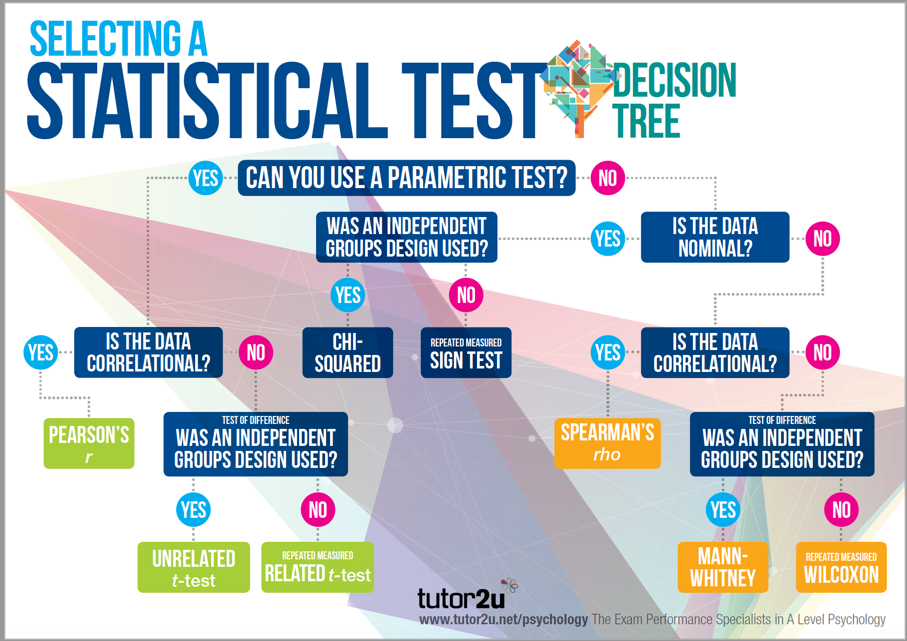 ] .pull-right[ - data preparation - Chi-Square Test - Interpretation 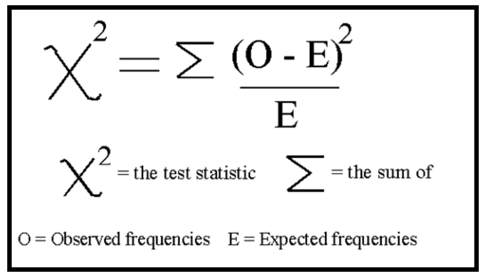 ] --- ## 14C Calibration ### What is it .pull-left[ 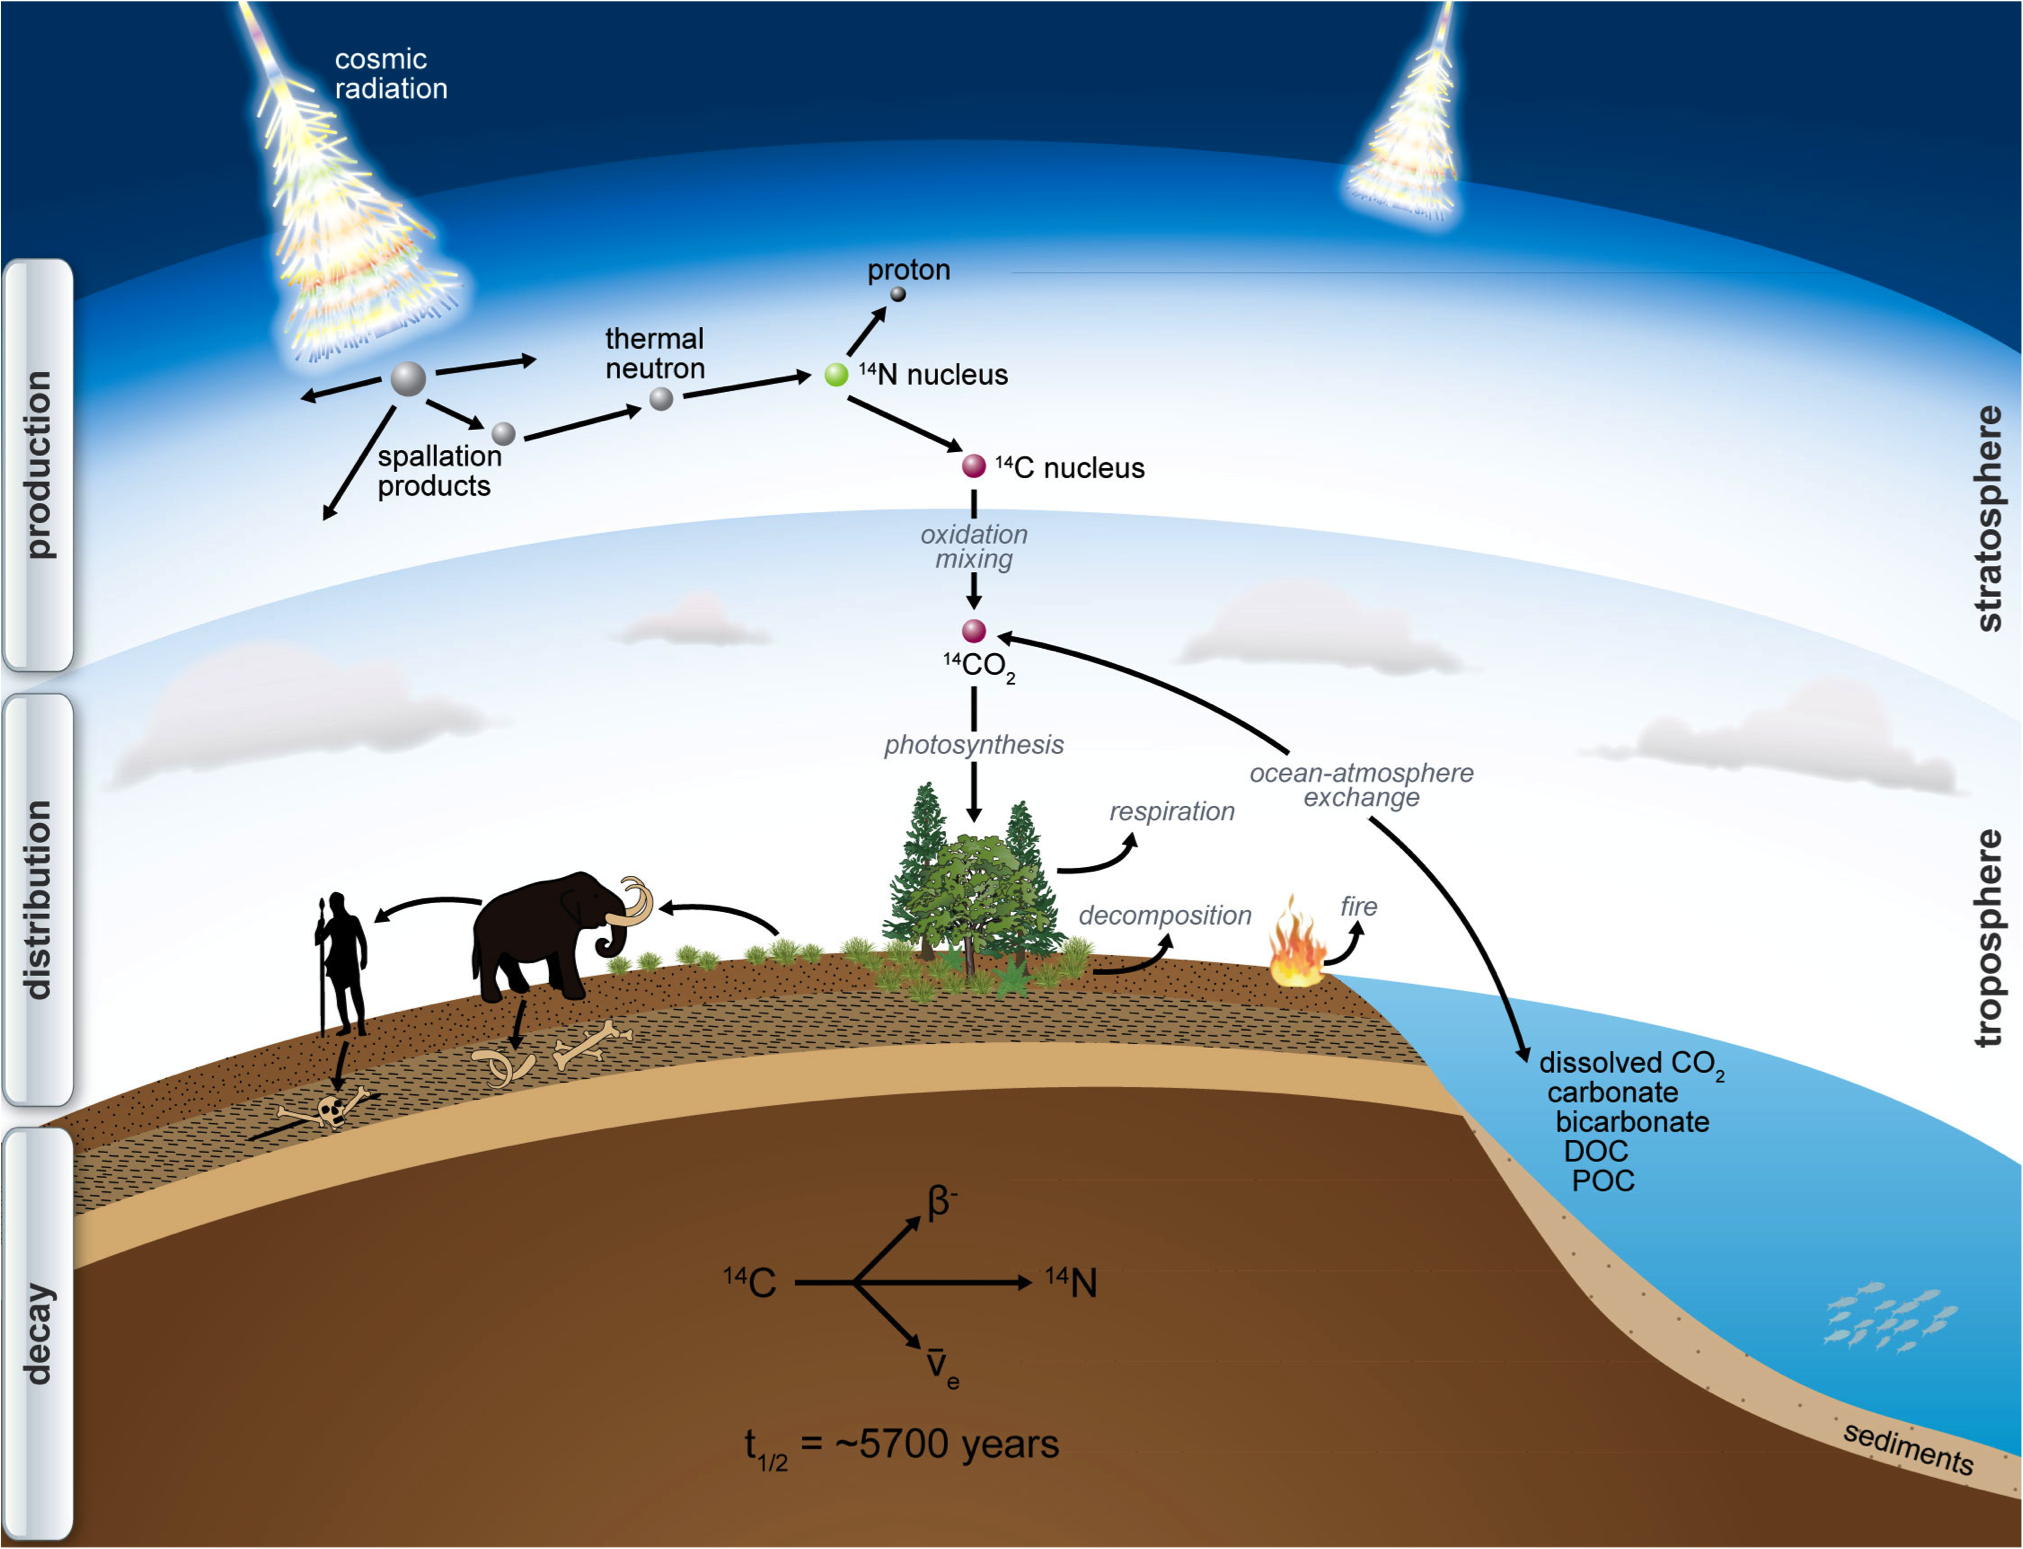 ] .pull-right[ 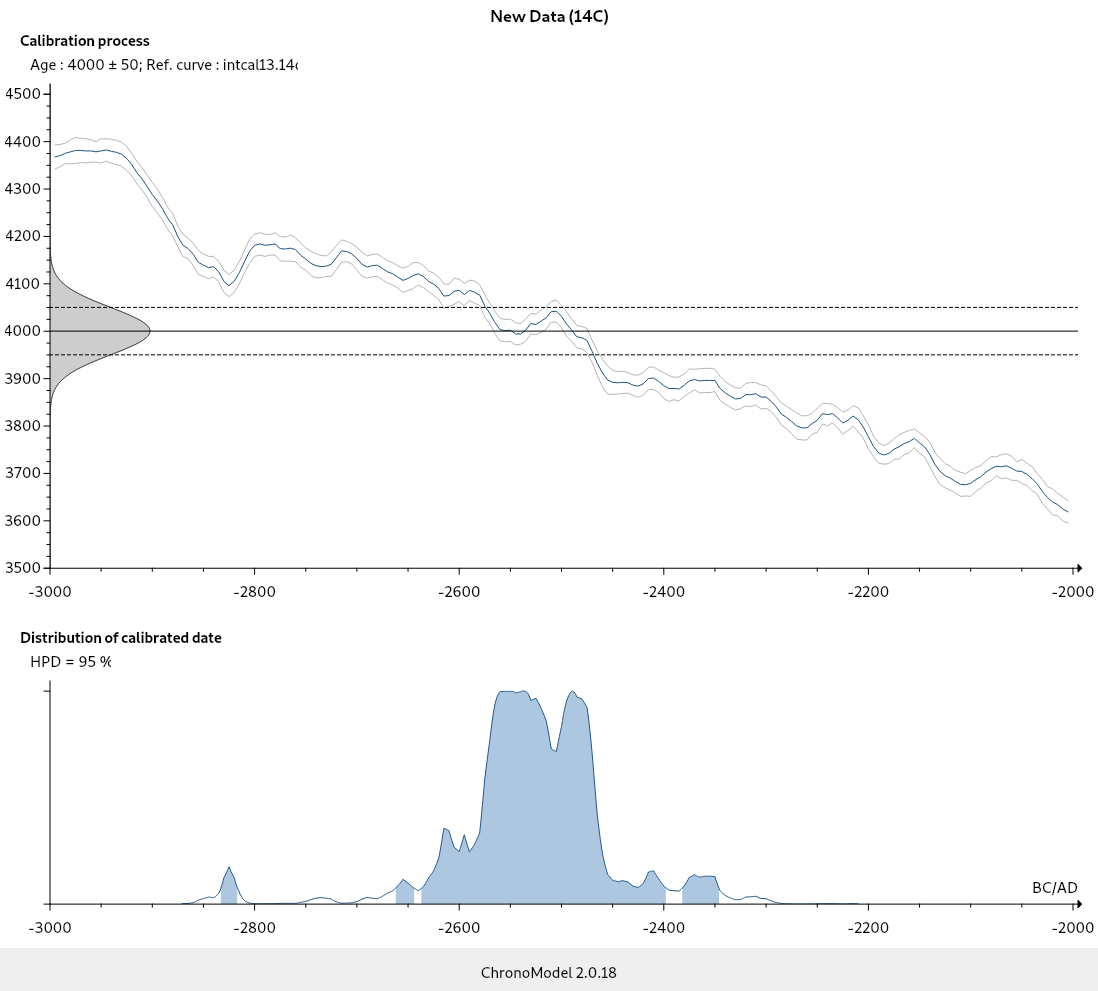 ] --- ## 14C Calibration ### First section - understand the calibration process - being able to calibrate individual dates .center[ 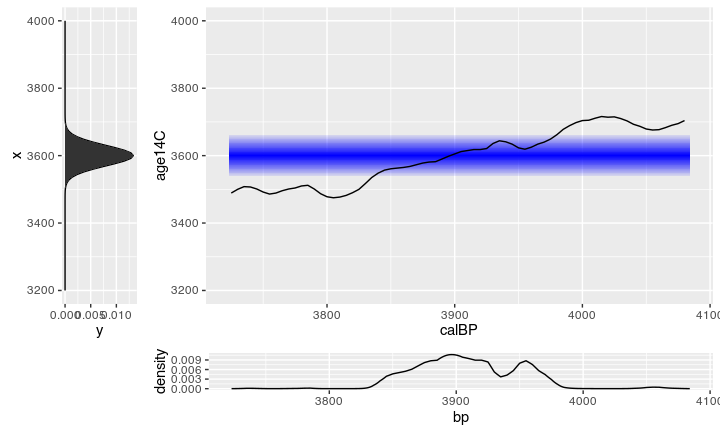 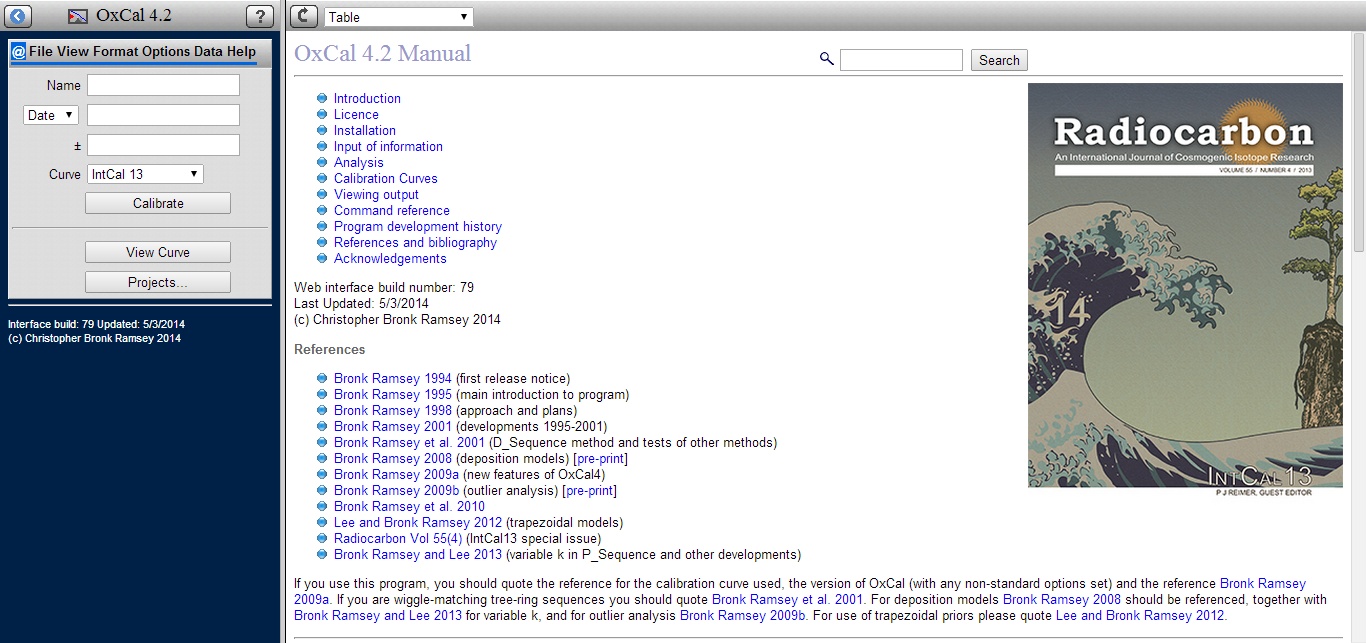 ] --- ## 14C Calibration ### Second section - translate stratigraphical sequences into OxCal models - doing sequential calibration .center[ 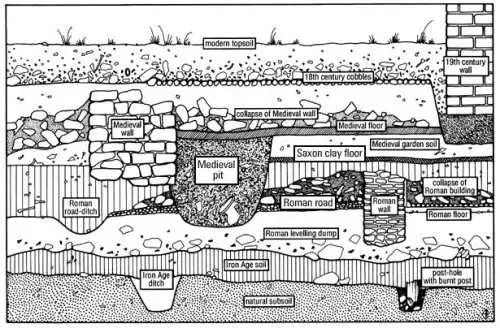 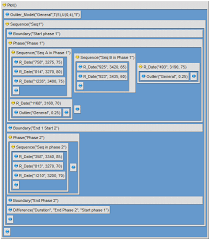 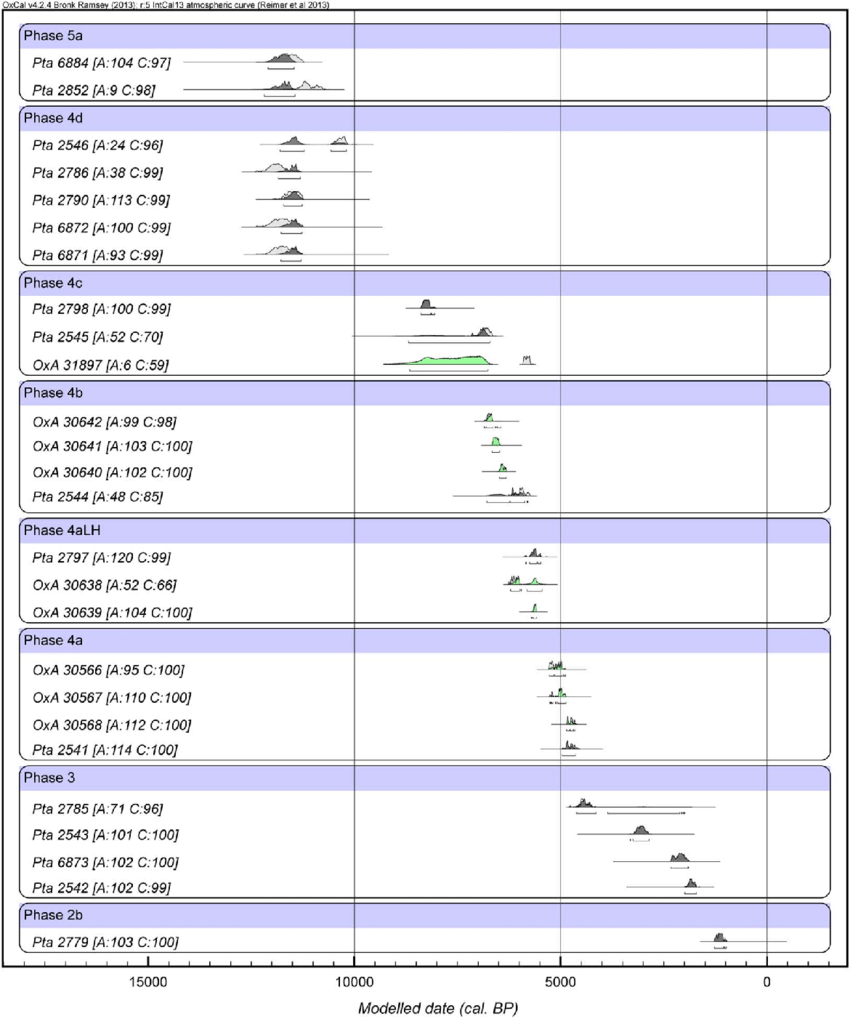 ] --- ## GIS ### What is it > A geographic information system (GIS) is a system designed to capture, store, manipulate, analyze, manage, and present spatial or geographic data. - Wikipedia .center[ 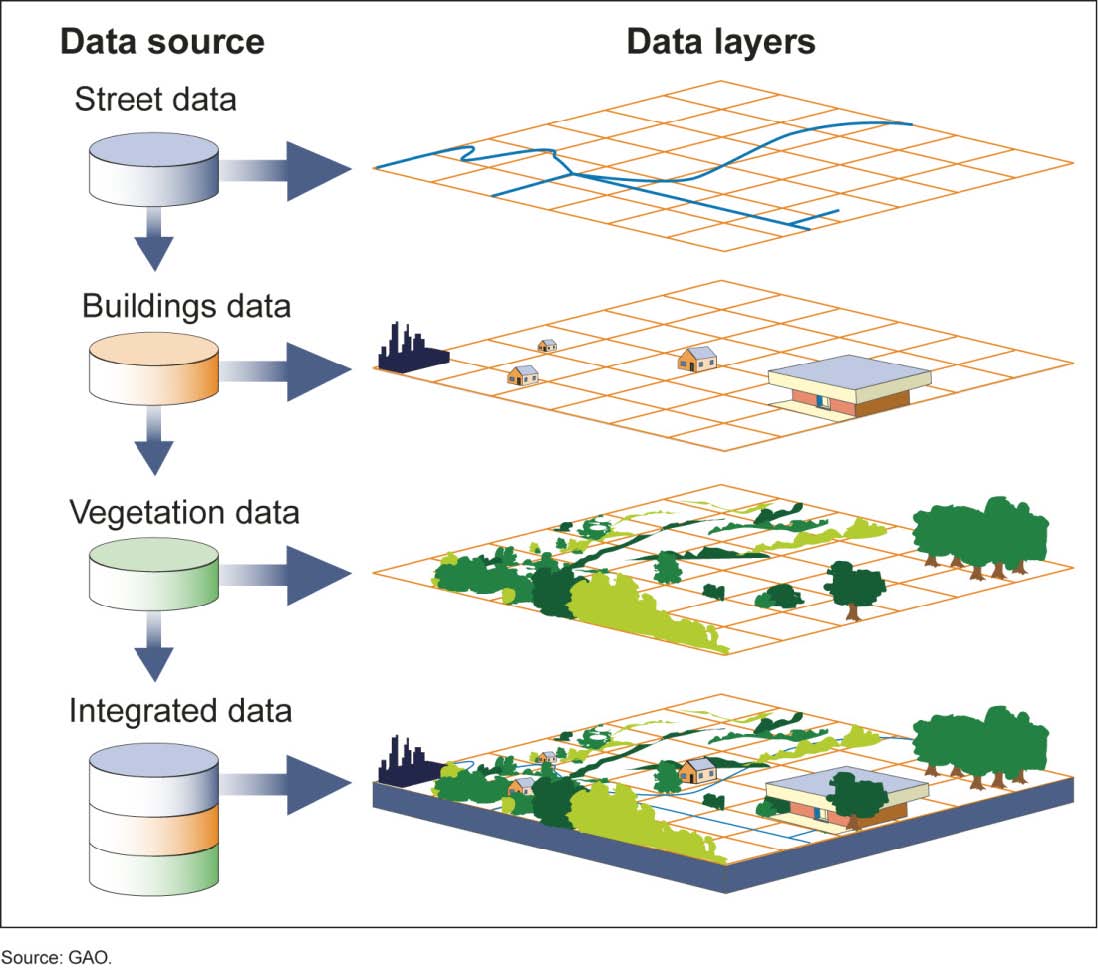 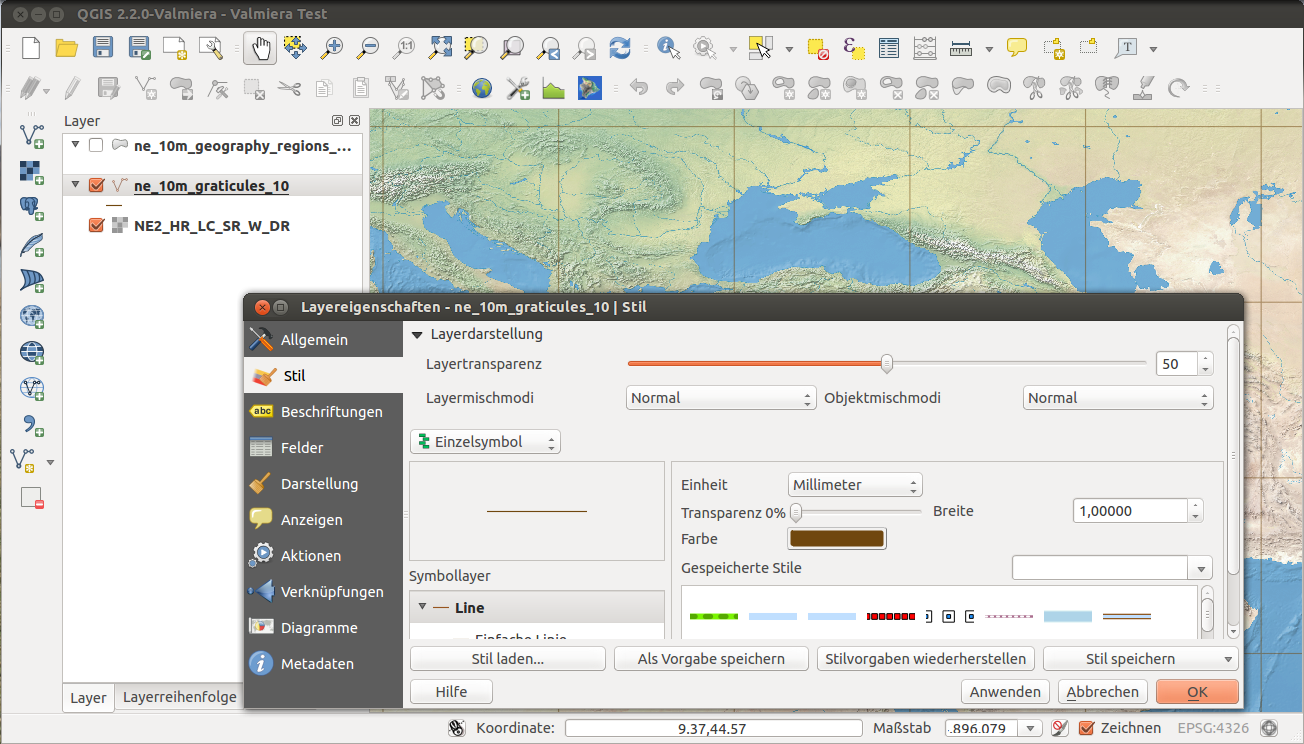 ] .right[  ] --- ## GIS ### First section - basically understand projection systems - being able to map geographical locations with background maps - digitizing/georeferencing maps 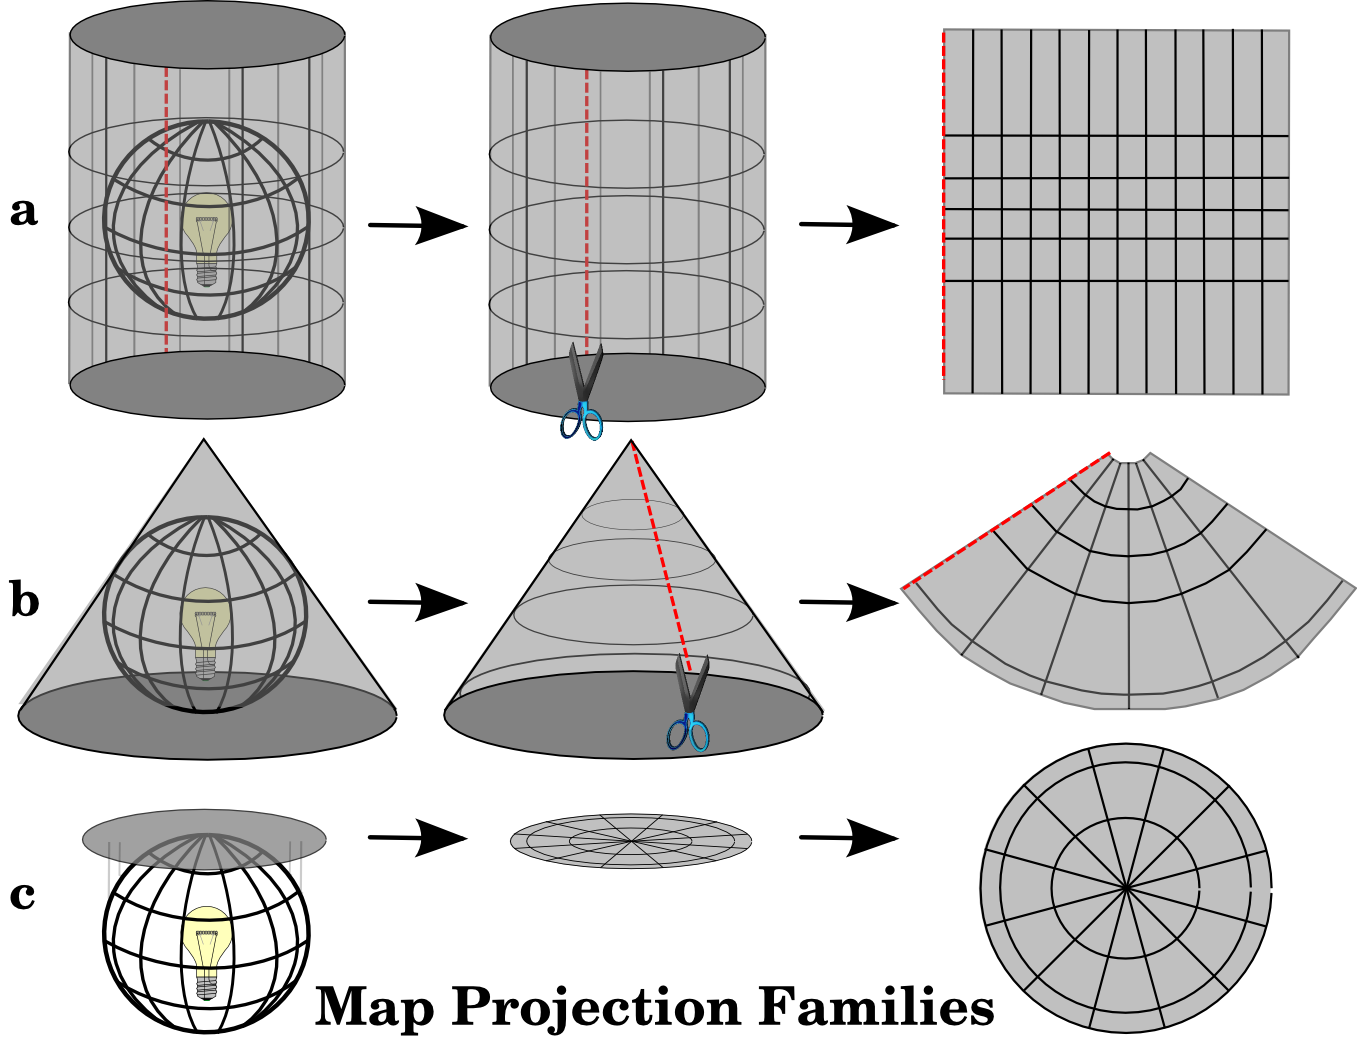 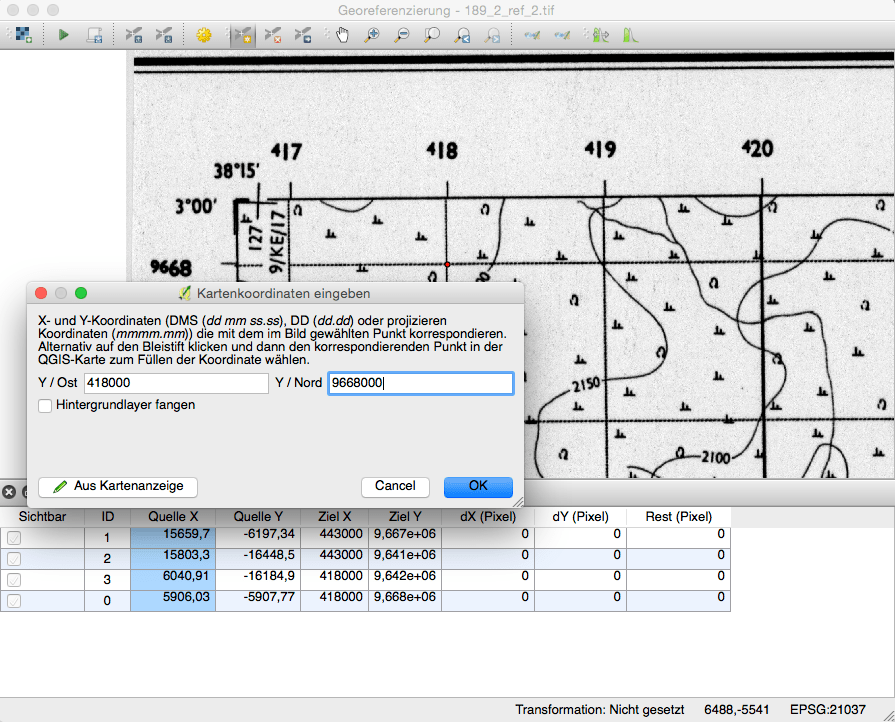 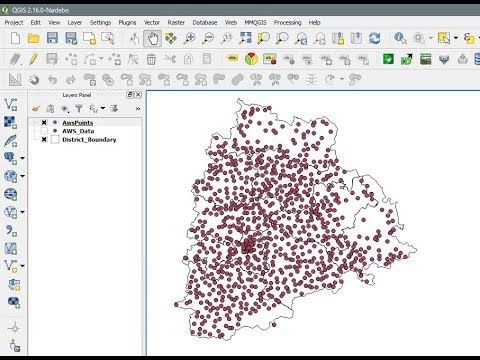 --- ## GIS ### Second section - thematic mapping - interpolation .center[ 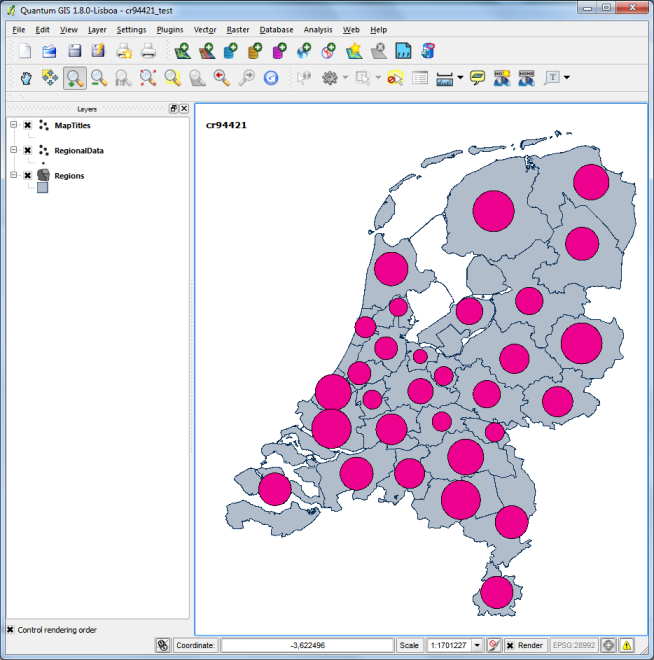 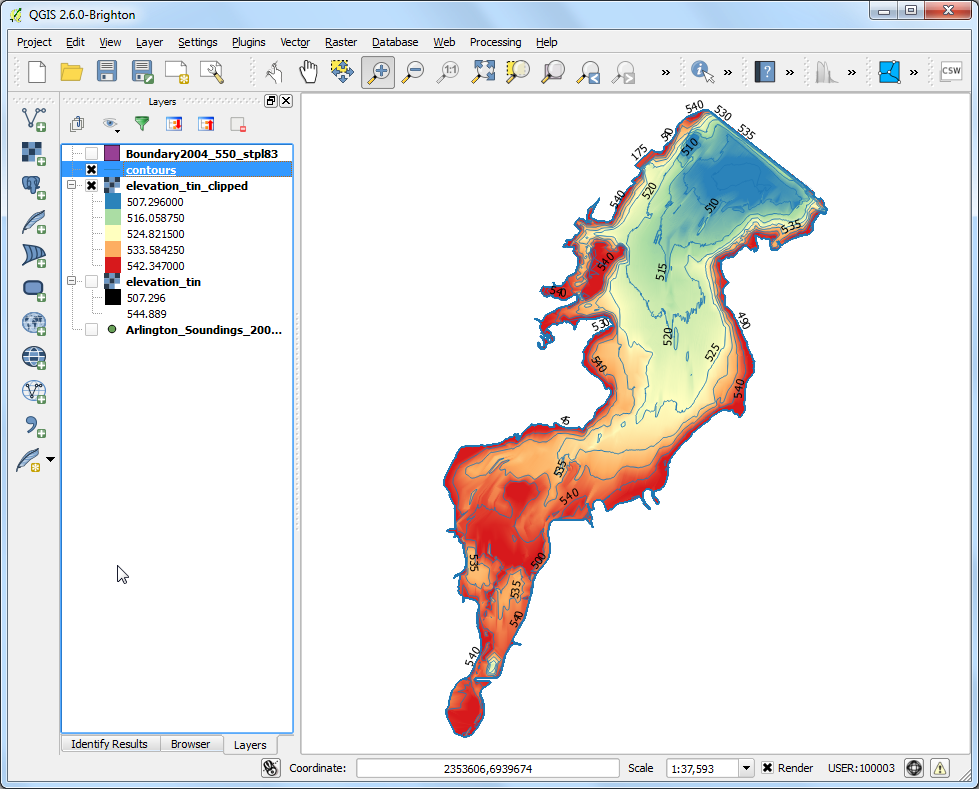 ] --- ## Digital Documentation ### What is it using electronic devices to - record informations in the field - measure and geolocalise finds - document features (eg. orthophoto) - make 3D models - of terrain and architecture - artefacts 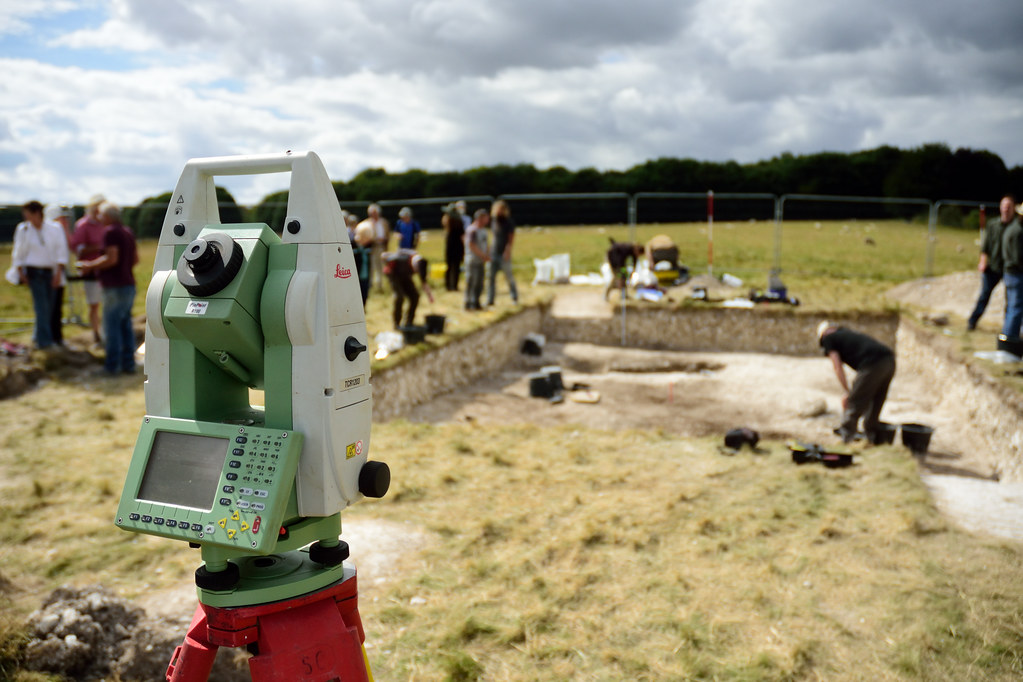 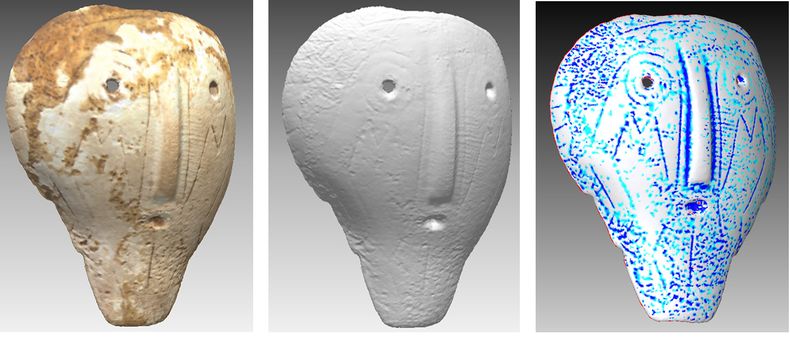 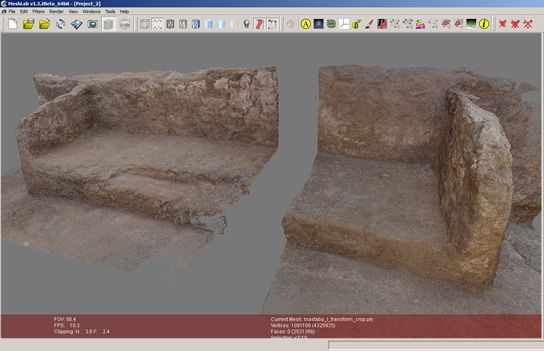 --- ## Digital Documentation ### Only section - Overview about methods for digital documentation and recording - devices, software, techniques ### To be continued next semester --- ## Software in this course - free (and most of the time) open source software - most basic software .small[ ### Zotero - free and open source (FOSS) citation manager - integrates well in browser and Office Software ### Libre Office - FOSS office package - most commands and procedures similar to 'the other' office package ### OxCal - free, but not open source - quasi standard in archaeology ### QGIS - FOSS GIS package - General ideas and concepts are transferable to 'the other' GIS software ] --- ## Prerequisite for successful participation - a laptop (if you do not own one, we can provide you) - endurance - curiosity - installing some software And in the end a test, consisting of a theoretical and a practical part Test will be written after the semester. --- ## ToDo till next meeting - Install Libre Office (https://de.libreoffice.org/) - Install Zotero (https://www.zotero.org/) - (optional) install Zotero Connector (https://www.zotero.org/download/connectors) --- class: inverse, middle, center # Any questions? .footnote[ .right[ .tiny[ You might find the course material (including the presentations) at https://github.com/MartinHinz/ca_hs_2019 You can see the rendered presentations at http://martinhinz.github.io/ca_hs_2019 You can contact me at <a href="mailto:martin.hinz@iaw.unibe.ch">martin.hinz@iaw.unibe.ch</a> ] ] ]